
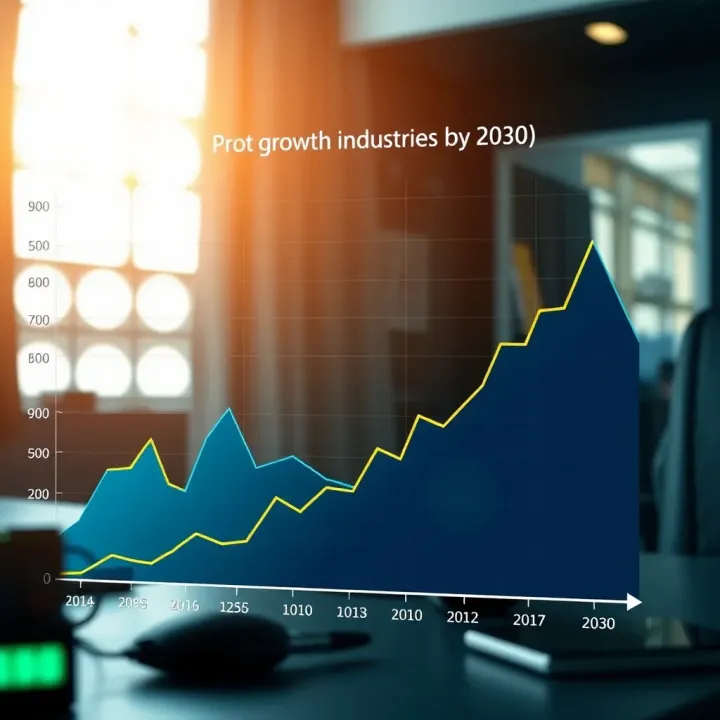
Reliance Industries Market Outlook 2030
Explore Reliance Industries' growth by 2030 📈, including key sectors, strategies, challenges, and impact on India’s economy and global markets 🌏.
Edited By
James Thornton
The AUD/USD pair remains one of the most closely watched currency pairs by traders and investors across the globe. It reflects the economic health of Australia and the United States, and its fluctuations offer critical insights into global financial trends. Understanding what drives its movement can help market participants make informed decisions—whether for short-term trades or long-term investment strategies.
Australia's economy depends heavily on commodity exports, particularly iron ore and coal, which means the AUD often correlates with global commodity prices. Meanwhile, the US dollar, as the world's reserve currency, reacts strongly to Federal Reserve policies, economic data like non-farm payrolls, inflation reports, and geopolitical developments.

Changes in interest rates by the Reserve Bank of Australia (RBA) or the US Federal Reserve (Fed) directly impact AUD/USD exchange rates, sometimes within hours of announcements.
Recently, shifts in monetary policy have caused notable swings. For instance, the Fed's hawkish stance tightened the dollar's grip, pushing AUD/USD lower, while any sign of a dovish shift tends to brighten the Australian dollar's prospects. Traders should watch out for economic indicators such as GDP growth rates, trade balances, and employment figures from both countries.
In addition to domestic factors, global events like US-China trade tensions or disruptions in supply chains also exert pressure on this pair. For example, during periods of risk aversion triggered by geopolitical unrest, the AUD—often seen as a risk-on currency—may weaken against the USD, which investors flock to as a safe haven.
To navigate AUD/USD effectively, traders should track:
RBA and Fed policy meetings and statements
Key economic indicators like CPI (Consumer Price Index), retail sales, and employment data
Global commodity price trends impacting Australian exports
Geopolitical developments affecting risk sentiment
With markets becoming more volatile due to unpredictable global factors, combining technical analysis with fundamental insights provides a stronger edge in forecasting AUD/USD movements. Staying updated and flexible will be key for anyone focusing on this currency pair in the coming months.
Understanding the AUD/USD currency pair is essential for traders and investors dealing with currencies linked to global commodities and economic trends. This pair reflects the exchange rate between the Australian Dollar (AUD) and the US Dollar (USD), two major currencies with substantial trade and financial connections. Keeping a close eye on it helps anticipate broader market movements and design effective trading strategies.
The AUD/USD pair ranks among the most traded currency pairs worldwide, popular due to Australia’s strong commodity exports and the US dollar’s role as a global reserve currency. Traders watch it for its liquidity and responsiveness to data releases from both countries. For instance, changes in US Federal Reserve interest rates or Australian employment reports can cause quick price swings, providing opportunities for short-term trading.
Australia’s economy largely depends on commodity exports like iron ore, coal, and natural gas. Consequently, the AUD/USD rate often reflects the health of global commodity markets. When demand from China or other major buyers strengthens, the AUD tends to rise versus the USD, showing how trade ties influence forex movements. Businesses involved in importing or exporting between the US and Australia also closely monitor this pair to manage currency risks.
AUD/USD usually experiences moderate volatility, with spikes often linked to Australian or US economic announcements. It tends to follow cyclical patterns aligned with commodity price changes and central bank meetings. For example, during the Australian budget release or US non-farm payroll days, volatility can increase significantly, affecting stop-loss levels and trade timing.
The AUD/USD pair saw notable fluctuations amidst global economic shifts and crises. Between 2018 and 2020, it fell sharply due to trade tensions and the pandemic’s impact but started recovering in 2021 as commodity prices surged. Understanding these trends helps traders position themselves in anticipation of similar cycles.
Economic expansions and contractions in both countries directly influence the pair. For example, Australia’s growth period supported by a mining boom usually pushes AUD upwards, whereas US recessions or policy tightening often strengthen the USD. Recognising these cycles can enhance forecasting accuracy.
Key events like the Reserve Bank of Australia’s rate cuts or unexpected US Federal Reserve announcements have triggered sharp moves of several hundred points in the pair. For example, in March 2020, as the pandemic crisis escalated, AUD/USD dropped rapidly before rebounding, showing how external shocks create trading opportunities.
Staying updated on the characteristics and past behaviour of AUD/USD equips traders with the context necessary to anticipate future movements effectively.
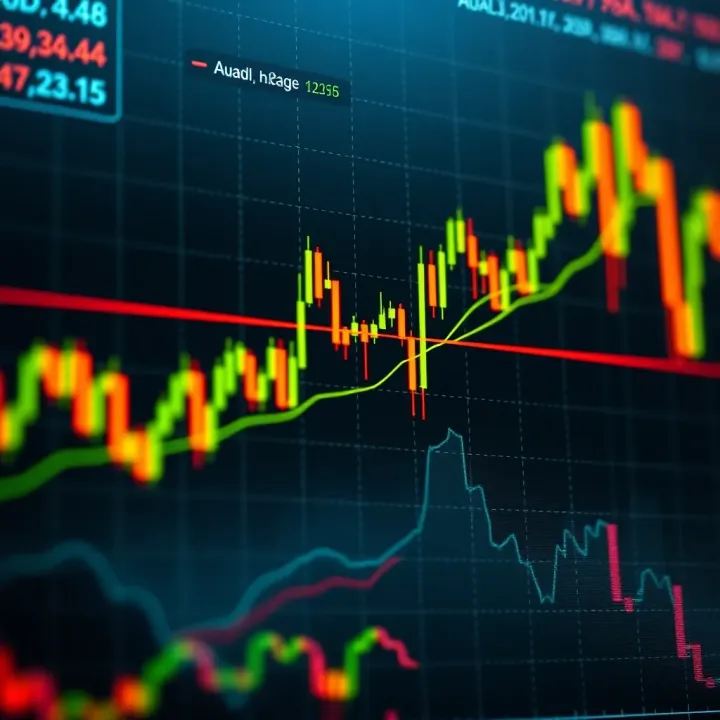
This section grounds you with practical insights on the AUD/USD pair’s nature, helping inform your forecasting and trading decisions.
Economic factors shape the price action of the AUD/USD currency pair significantly. Traders and investors watch these closely because they reveal underlying strengths or weaknesses in Australia’s and the US’s economies. This section breaks down key drivers on both sides, helping you grasp what moves the pair and why.
Interest rates set by the Reserve Bank of Australia (RBA) are critical in influencing the AUD/USD rate. When the RBA raises rates, the Australian dollar tends to strengthen because higher yields attract foreign capital. For instance, in late 2023 when the RBA increased policy rates to combat rising inflation, the AUD saw temporary gains. Conversely, rate cuts signal a softer economic outlook and weigh on the currency. Traders should keep an eye on RBA statements and meeting outcomes to anticipate shifts.
Australia’s trade balance, especially related to commodity exports like iron ore, coal, and natural gas, heavily impacts the AUD. A surplus usually supports the currency, reflecting strong demand for exports, which bolsters foreign earnings. For example, fluctuations in iron ore prices, a major export, often move the AUD/USD pair. If China reduces imports amid slowing growth, AUD might weaken as export revenues fall. Thus, monitoring commodity markets alongside Australia’s trade statistics gives insight into AUD movements.
Inflation trends and employment figures give clues about economic health and policy direction. Rising inflation often prompts the RBA to consider tightening, supporting the AUD. Meanwhile, a strong employment report indicates a robust economy. For instance, a steady drop in unemployment to below 4% in Australia recently boosted confidence in economic recovery, lifting the currency. Traders should watch Consumer Price Index (CPI) updates and labour reports as they can trigger short-term volatility.
The US Federal Reserve’s monetary policy is a major driver for the AUD/USD pair. When the Fed hikes interest rates to control inflation, the US dollar usually strengthens, pulling AUD/USD down. In contrast, dovish Fed moves tend to weaken the dollar, pushing the pair higher. During 2023, the Fed’s cautious approach amid inflation cooling influenced the pair’s swings. Market participants monitor Fed minutes, speeches, and rate decisions closely to gauge future moves.
US GDP growth and employment rates indicate the health of America’s economy, affecting the USD’s strength. Strong economic data increases investor confidence in the dollar. For example, robust non-farm payroll reports often result in USD gains, causing AUD/USD to dip. On the other hand, any setbacks or slowing growth in the US can weigh on the dollar and lift the AUD/USD rate. Tracking US quarterly GDP and monthly jobs data helps traders forecast pair direction.
US inflation figures and consumer spending behaviour shape expectations for Federal Reserve policy and thus impact AUD/USD. Higher inflation pushes the Fed towards rate hikes, strengthening the dollar. Meanwhile, consumer spending, which makes up a large part of US GDP, reflects economic momentum. Weak spending might signal softer growth, weakening the dollar. For example, subdued retail sales in recent months contributed to a more mixed outlook for the pair. Monitoring CPI and retail sales data aids in anticipating market reaction.
Understanding these economic indicators provides a solid foundation for navigating the AUD/USD market effectively. Keeping tabs on key reports in Australia and the US allows traders to make informed decisions rather than relying on guesswork.
Monitor Reserve Bank of Australia and Federal Reserve announcements
Track commodity price changes affecting Australia’s trade balance
Analyse inflation and employment data from both countries
This focused approach helps anticipate short-term volatility and medium-term trends in the AUD/USD currency pair.
Global events and external factors carry significant weight in shaping the AUD/USD currency pair's movements. Traders and analysts closely monitor these influences because they often override domestic economic signals, leading to sharp shifts in the pair's value. Understanding these elements can improve timing and decision-making in trading strategies.
Role of metals and energy prices: Australia’s economy depends heavily on commodities like iron ore, coal, and natural gas. Prices of these metals and energy sources frequently sway the AUD/USD value because Australia is a major exporter. For example, when iron ore prices surged to near-record highs in late 2021, the Australian dollar strengthened sharply against the US dollar. Conversely, declines in global energy demand or oversupply in coal can weaken the AUD, reflecting lower export revenues.
Connection to Australian export earnings: Since commodities make up a large share of Australia's export basket, fluctuations in their prices directly affect the country's trade balance and, by extension, the AUD/USD exchange rate. If commodity prices fall, export earnings shrink, causing potential capital outflows and a weaker Australian dollar. This is particularly crucial during periods of global economic slowdown when demand for raw materials falls, impacting Australia’s trade surplus and putting downward pressure on the AUD.
US-China trade tensions: Trade relations between the US and China remain a key geopolitical factor affecting AUD/USD. Australia’s economy has close ties with China, its biggest trading partner. Escalations in tariffs or sanctions between these two giants can disrupt trade flows, impacting demand for Australian commodities and thus the AUD. For instance, recent steel export restrictions to China have caused ripples in the AUD market, highlighting how external disputes influence currency valuation indirectly.
Regional agreements affecting Australia: Free trade agreements (FTAs) such as the Regional Comprehensive Economic Partnership (RCEP) play an important role in strengthening Australia’s trade ties in Asia. Enhanced market access through such deals can promote exports, support local industries, and offer stability to the AUD. Traders watch announcements and updates related to these agreements closely for hints at future currency movements.
Impact of global crises on investor sentiment: Global crises—like pandemics, wars, or financial collapses—shift investor behaviour dramatically. The AUD, often seen as a risk-sensitive currency, tends to weaken when global risk aversion rises. For example, during the early stages of the COVID-19 pandemic, the AUD/USD dropped sharply as investors sought safe-haven currencies like the US dollar. On the flip side, improvement in global stability tends to lift the AUD as investors chase higher returns, benefiting from Australia’s relatively higher interest rates.
Effectively tracking these global events helps traders anticipate shifts in AUD/USD, providing an edge beyond simple economic data analysis.
Technical analysis helps traders make sense of the AUD/USD’s recent movements, showing not just where the price has been but signalling where it might go next. This section zooms into patterns, key price levels, and trading signals that are crucial for timing entries and exits. For traders and analysts, understanding these details can mean the difference between riding a trend profitably and getting caught in avoidable reversals.
Support and resistance zones act like invisible barriers that the AUD/USD price tends to respect. Support zones form where buying interest is strong enough to halt a decline, often marking good entry points. Resistance zones, conversely, appear where selling pressure caps price advances and often serve as exit signals. For example, the 0.70 level has historically acted as a psychological support for AUD/USD, prompting buyers to step in whenever prices approach this range. Watching these zones helps you anticipate price bounces or breakouts, avoiding costly surprises.
Moving averages and trend indicators give a smooth view of price trends by averaging recent data points. The 50-day and 200-day moving averages are popular choices for AUD/USD traders. When the short-term average crosses above the long-term one, it signals potential bullish momentum; the opposite suggests a bearish trend. For instance, a recent crossover in the moving averages indicated the start of a short-term uptrend. Trend indicators like the Average Directional Index (ADX) measure strength of these moves, helping traders decide whether to ride a trend or wait it out.
Volume and momentum analysis offer insights into the conviction behind price moves. Rising volume alongside price gains confirms strong buyer interest in AUD/USD, suggesting continued upward pressure. Conversely, if momentum indicators like the Relative Strength Index (RSI) show overbought conditions while volume drops, it hints at a possible reversal. This interplay assists traders in validating price trends and spotting exhaustion early, refining their trade timing.
The short-term outlook for AUD/USD often hinges on immediate economic releases and market reactions. Many experts watch Australian employment data and US Federal Reserve signals closely. For example, a recent upbeat jobs report from Australia pushed AUD/USD slightly higher within days. Traders use these short-term forecasts to position for quick moves, balancing the risk of volatile swings around announcements.
In contrast, medium to long-term expectations consider broader economic trends like commodity price trajectories and geopolitical developments. Many forecasts currently factor in China's economic demand for Australian exports, which could keep AUD/USD supported over months. Understanding this helps investors align their portfolios with probable currency shifts while managing risk over longer horizons.
Finally, sentiment indicators and trader positioning shed light on market psychology. Tools such as the Commitment of Traders (COT) report show how large forex players position themselves in AUD/USD, often preceding major price pivots. If most traders are leaning heavily bullish, contrarian investors might watch for a correction. Monitoring such sentiment prevents blindly following the crowd, providing a more nuanced view of market dynamics.
Keeping tabs on recent trends and technical signals in AUD/USD equips you to better manage trades, anticipate key movement phases, and make decisions grounded in both price action and market mood.
Understanding strategies for trading the AUD/USD pair helps you navigate its unique price movements. The pair is influenced by various economic indicators and global events, making disciplined strategies vital to managing risk and seizing opportunity. Successful traders combine risk management, timing based on economic releases, and technical analysis to improve their chances of consistent profits.
Setting stop-loss and take-profit points is fundamental. A stop-loss limits your downside if the market moves against your position—say, you buy AUD/USD at 0.7300 and set a stop-loss at 0.7250, which prevents bigger losses if the pair weakens. Take-profit points lock in gains; for instance, setting a target at 0.7400 means you automatically exit once that level is reached. This method avoids emotional decision-making, which often leads to rushed exits or holding on too long.
Position sizing and exposure control ensure you don’t risk too much on any single trade. A common rule is to risk no more than 1–2% of your trading capital per position. For example, if your trading capital is ₹5 lakh, risking ₹5,000-₹10,000 per trade keeps losses manageable. Also, diversifying your trading across different assets or time frames helps avoid being too exposed to one market shock. Proper sizing prevents wiping out your account during volatile swings in AUD/USD.
Monitoring Australian and US reports is crucial because economic data often triggers sharp moves in the AUD/USD pair. Key reports include Australian employment figures, commodity prices, or Reserve Bank of Australia (RBA) announcements, alongside US Federal Reserve policy updates and US jobs data. Traders watching these releases can position themselves early to benefit from forecast beats or misses.
Handling unexpected market reactions requires quick adjustments. Sometimes markets react unpredictably, despite expectations—like a good jobs report causing the AUD to weaken due to anticipated Fed tightening. Being flexible and ready to cut losses or lock in profits is essential. Using alerts and having clear plans helps avoid getting caught on the wrong side during surprising volatility.
Indicators suited for AUD/USD include moving averages, Relative Strength Index (RSI), and Bollinger Bands. Moving averages help spot trends—if the 50-day moving average crosses above the 200-day, it indicates a bullish trend. RSI shows whether the pair is overbought or oversold, guiding entries or exits. These tools work well with AUD/USD due to its mix of trend-following and range-bound moves.
Chart patterns to watch include triangles, head and shoulders, and double tops or bottoms. For example, a falling wedge on AUD/USD might signal a breakout to the upside. Recognising these patterns early helps traders enter with better timing and set stop-loss levels based on pattern boundaries. Patterns combined with volume analysis improve the reliability of signals.
Effective trading in AUD/USD blends risk management, economic timing, and technical know-how. By setting clear stops, sizing positions prudently, watching economic cues, and using chart tools, traders can make informed decisions and avoid costly mistakes.
Explore Reliance Industries' growth by 2030 📈, including key sectors, strategies, challenges, and impact on India’s economy and global markets 🌏.

📈 Explore Reliance’s strategic goals, market moves, and stock outlook for tomorrow, plus investment tips in India’s fast-paced economy.

Explore Reliance's path ahead in India & beyond 📈, focusing on growth trends, tech innovations, strategies, and key challenges shaping its future.

📈 Explore Reliance Industries' share price outlook for 2025 with insights on business segments, financial trends, and expert analyst predictions. 💹
Based on 9 reviews