

Ripple Coin Price Prediction and Market Insights
📊 Discover Ripple Coin's price trends, tech updates, market shifts, and regulations. Get expert insights to navigate your investment decisions wisely.
Edited By
Emily Clarke
TradingView has become a go-to charting platform for traders and investors keen on understanding market movements better. It offers vast tools to visualise price action, identify trends, and spot entry or exit points with ease. Whether you trade equities, commodities, cryptocurrencies, or forex, TradingView's interface allows you to customise charts to suit your strategy.
Indian traders especially benefit from TradingView's integration with domestic and global exchanges, real-time data, and community-driven insights. The platform supports various chart types such as candlestick, bar, line, Renko, and Heikin Ashi — each offering a distinct way to look at price behaviour.
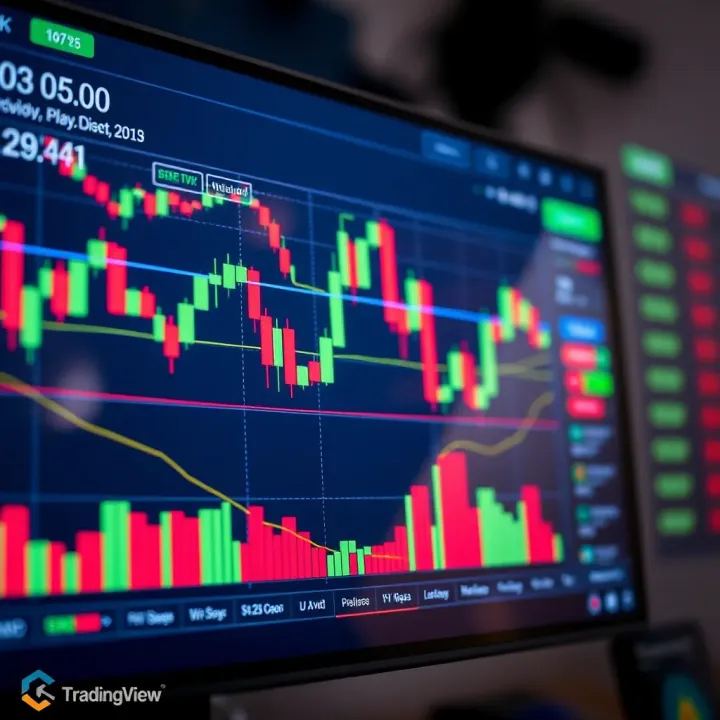
Getting comfortable with chart analysis on TradingView means learning how to read price patterns, apply technical indicators, and set alerts effectively. For example, beginners often start with moving averages to gauge trend direction or RSI (Relative Strength Index) to spot overbought or oversold conditions.
Understanding how to personalise charts — like adjusting timeframes from 1 minute to 1 month, adding volume bars, or annotating price levels — helps convert raw data into actionable signals.
Here are some key points to keep in mind:
TradingView's cloud-based charts work smoothly on both desktop and mobile, allowing uninterrupted access.
You can save chart layouts and templates, saving time during busy market hours.
The community feature lets you explore publicly shared trade ideas and scripts, which can broaden your perspective.
Mastering these basics sets the stage for deeper analysis, such as combining multiple indicators or backtesting strategies using TradingView's Pine Script coding environment. This article will navigate these essentials, giving Indian traders a practical edge in their market decisions.
Getting started with TradingView charts is vital for traders aiming to make informed market decisions. These charts provide advanced visual tools that help decode price movements, volume, and trends across various markets. A clear understanding of the chart features lays foundation for mastering deeper technical analysis, enhancing your ability to spot trading opportunities and manage risks effectively.
TradingView is a cloud-based charting and social networking platform widely used by retail traders and investors globally. Its practical relevance lies in offering real-time chart data and analysis tools in one accessible place. The platform supports multiple asset classes such as equities, commodities, forex, and cryptocurrencies, making it a one-stop solution regardless of your trading focus.
One of TradingView's strengths is its extensive global market coverage. Indian traders can access live quotes from NSE and BSE alongside data from major international exchanges like NYSE and NASDAQ. This global access allows investors trading Indian stocks while keeping an eye on global cues, such as US Federal Reserve announcements or commodity prices, which often impact Indian markets.
TradingView works seamlessly across devices – desktop, tablet, and mobile phones have full access to charts and alerts via apps or browsers. This flexibility means you can monitor your portfolio on the go, whether commuting or travelling. Indian traders especially benefit from mobile compatibility, given the widespread use of smartphones for financial tracking.
Candlestick charts are the most popular format on TradingView. Each candle shows the open, high, low, and close prices over a time period, making it useful to spot price action and patterns quickly. Indian traders rely on candlesticks to identify reversals or continuation trends during volatile sessions like post-budget announcements.
Line charts connect closing prices over a period with a simple line. While less detailed than candlesticks, they help focus on overall price direction without noise from intra-period movements. This can be handy when checking the general trend of a stock like Reliance Industries over months.
Bar charts provide similar data to candlesticks but in a different visual. Each bar shows the open, high, low, and close but uses vertical lines and small ticks to mark openings and closings. This format appeals to traders who prefer minimalist visuals but want key price info at a glance.
Renko charts filter out minor price fluctuations by constructing bricks only when price moves a set amount. This helps focus solely on significant trends without time-based noise. Other specialised charts like Kagi or Point and Figure chart offer unique ways to identify support, resistance, and breakout points. For Indian traders dealing with high volatility during earnings seasons, these charts add clarity to market moves.
Choosing the right chart type on TradingView lets you tailor your analysis to your trading style. Experimenting with them can reveal different market perspectives critical in making sharp, confident trading decisions.
Grasping key chart elements and indicators is fundamental for making informed trading decisions. These components provide clear insights into market behaviour, helping traders and investors anticipate trends and spot opportunities with more confidence. Without understanding these basics, even advanced tools can lead to guesswork rather than strategy.
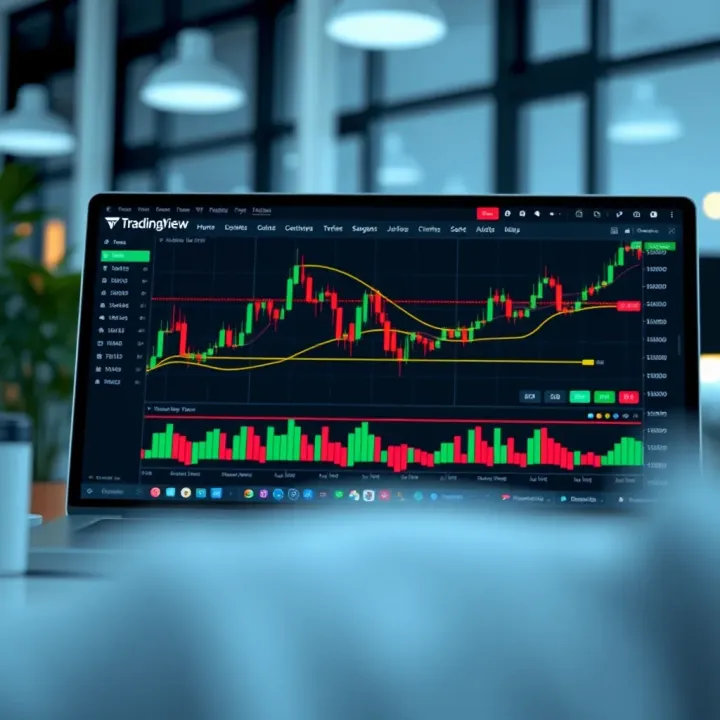
The price axis, usually on the right side of the chart, shows the price levels a stock or asset has traded at, while the time axis at the bottom marks the timeline of these price movements. Traders track price changes over specific periods, from minutes to months, to understand market momentum. For example, spotting a steady price rise over weeks may signal a bullish trend worth exploring.
Volume bars depict the number of shares or contracts traded during a particular period and appear typically at the bottom of the chart. Rising volume alongside price increases often confirms the strength of a trend, while low volume during price changes may indicate a lack of conviction. For instance, if Reliance Industries Ltd sees a price surge backed by higher volume, it suggests genuine buying interest.
Support and resistance represent price points where buying or selling pressure historically reverses an asset's direction. Support acts as a floor where prices tend to stop falling, while resistance functions as a ceiling halting price rises. Recognising these can guide entry and exit decisions. For example, if Nifty 50 repeatedly bounces off 17,000 as support, it becomes a crucial level for traders to watch.
Moving averages smooth out price data to identify trends easily. Simple Moving Average (SMA) calculates an average over a set period, while Exponential Moving Average (EMA) gives more weight to recent prices. Indian traders often use the 50-day and 200-day EMAs to detect long-term trends. A crossover, like the 50-day moving above the 200-day, signals a potential buy.
RSI gauges the speed and change of price movements, indicating overbought or oversold conditions. Readings above 70 suggest an asset might be overbought, signalling a possible price correction, while below 30 hints at oversold conditions. For example, an RSI above 70 for Tata Motors could alert traders to a short-term pullback.
These bands encapsulate price movement within upper and lower limits based on standard deviations from a moving average. When prices touch the bands, it hints at volatility extremes. Traders look for contractions (low volatility) that often precede sharp moves. If Infosys stock stays near the upper band, it might be overextended.
MACD tracks momentum by comparing short-term and long-term EMAs. A MACD line crossing above the signal line may indicate bullish momentum, while the opposite suggests bearish trends. For example, a MACD crossover in HDFC Bank's chart could hint at a fresh upswing.
Knowing how to read these chart elements and indicators helps you separate market noise from actionable signals, making your trades smarter and timely.
Understanding these tools well will significantly sharpen your chart analysis using TradingView, enabling better timing and decision-making in dynamic markets like India's.
Customising charts enhances your ability to spot patterns and trends quickly, making analysis more effective and tailored to your trading style. TradingView enables several customisation options, from changing chart colours to setting alerts, allowing you to optimise your workspace for clearer insights.
Changing chart colours and styles gives you control over how market data visually appears, which can reduce eye strain during long analysis sessions. For example, using darker backgrounds with contrasting candle colours (green for bullish, red for bearish) can make price action stand out sharply, especially when working late hours. You can also switch between candlestick, line, or bar chart styles depending on what suits your trading method best—swing traders might prefer candlesticks, while long-term investors could lean towards line charts for simplicity.
Adding multiple charts on one screen lets you monitor several securities or time frames simultaneously without flipping tabs. For instance, if you are tracking a stock like Reliance Industries on daily and 15-minute charts, displaying these side by side helps you see long-term trends alongside short-term movements. This split view aids in spotting entry or exit points by comparing signals across intervals.
Saving chart layouts for regular use saves time by preserving your preferred set-up, including indicators, colours, and multiple chart arrangements. Once customised, you can quickly load these layouts during market hours instead of reconfiguring every time. Traders who analyse both equity and commodity markets can maintain separate layouts tailored to each asset class.
Using drawing tools for trendlines and patterns allows you to mark important price levels or formations directly on charts, aiding decision-making. Drawing trendlines helps identify support and resistance zones, while marking chart patterns like head and shoulders or triangles can highlight potential breakouts in advance. Regularly updating these drawings makes your analysis proactive, not reactive.
Custom alerts for price movements and indicators notify you instantly when market conditions meet your criteria—such as price crossing a moving average or RSI hitting overbought levels. This feature is particularly useful if you cannot watch charts non-stop. For example, setting an alert for Nifty reaching a key resistance can prompt timely actions without constant monitoring.
Organising notes and markers on charts helps consolidate your thoughts and trading hypotheses visually. By adding text notes or symbols at crucial points (like earnings dates or economic data releases), you create a personalised context for price actions. Such annotations can be revisited later for performance review or shared with peers for collaborative strategies.
Thoughtful chart customisation on TradingView makes your trading more structured and less stressful, boosting confidence in your market calls.
Overall, mastering these customisation tools can greatly improve your chart-reading efficiency and support smarter, faster trading decisions.
TradingView charts play a valuable role in shaping your investment and trading strategies. They help bridge the gap between raw market data and actionable decisions by offering visual insights into price movements, trends, and market sentiment. Using TradingView, you can combine various technical indicators and chart patterns to pinpoint ideal entry and exit points, helping you optimise profits and cut losses.
The Relative Strength Index (RSI) and Moving Average Convergence Divergence (MACD) are widely used technical indicators that complement each other well when combined. RSI measures momentum to indicate if an asset is overbought or oversold, while MACD tracks changes in trend direction and strength. For instance, if RSI shows an oversold condition (below 30) and MACD signals a bullish crossover, it creates a stronger case for entering a long position. This combination reduces false signals and increases the chance of a successful trade.
Moving averages smooth out price data and reveal trend directions. Crossovers between different moving averages provide clear entry and exit signals. A common method is to observe the 50-day and 200-day moving averages: when the 50-day crosses above the 200-day, it indicates a potential upward trend (a ‘golden cross’). Conversely, the 50-day crossing below the 200-day (a ‘death cross’) suggests a bearish trend. Using these crossings can help you decide when to buy or sell, especially in trending markets.
Chart patterns like head and shoulders, double tops and bottoms, or triangles often signal trend reversals or continuations. TradingView’s drawing tools let you identify these patterns easily. For example, spotting a double bottom near a support level hints at a possible upward reversal, signalling a buying opportunity. Recognising these patterns strengthens your decision-making by adding a visual element to confirm or question indicator signals.
Support and resistance levels on charts mark price points where buying or selling pressure tends to pause or reverse. Using these levels to set stop-loss orders helps limit potential losses. For example, placing a stop-loss just below a strong support level when holding a long position ensures automatic exit if prices fall unexpectedly, protecting your capital. This discipline is especially critical in volatile markets.
Volume indicates the number of shares or contracts traded and confirms the validity of price moves. Rising prices accompanied by increasing volume suggest genuine buying interest, strengthening the trend’s reliability. On the other hand, price moves on low volume may lack conviction and can reverse quickly. Monitoring volume bars in TradingView alerts you to such shifts and helps avoid false breakouts.
TradingView lets you set custom alerts on price levels, indicator values, or even specific chart patterns. These alerts notify you instantly via mobile or email when key events occur, allowing timely actions without constant screen monitoring. For example, setting an alert for when a stock breaks its resistance zone means you won’t miss a potential breakout. This feature is vital for staying responsive in markets moving rapidly.
Combining these tools effectively can enhance your trading discipline and decision-making, turning market data into smart trades that align with your investment goals.
Applying TradingView charts in this way can help Indian traders navigate markets with improved timing, better risk control, and clearer insights tailored to real-time market behaviour.
TradingView serves as a powerful charting tool, but Indian traders must consider certain local factors to make the most of it. Access to accurate India-specific data, tailored subscription plans, and efficient use of features can greatly enhance decision-making and cost-effectiveness.
Live data for NSE and BSE stocks plays a significant role in trading strategies for Indian investors. TradingView provides access to real-time price movements and volume data from the National Stock Exchange (NSE) and Bombay Stock Exchange (BSE), enabling users to stay updated with current market conditions. For example, during volatile stock movements or earnings announcements, having live data helps traders react promptly rather than relying on delayed or end-of-day information.
Integrating such live feeds is not automatic for all users. Indian traders often need to subscribe to appropriate data packages on TradingView to receive this live information for NSE and BSE stocks, which can be a deciding factor in choosing subscription tiers.
Integrating Indian financial news within TradingView ensures traders stay informed about macroeconomic events, policy changes, or corporate updates affecting Indian markets. TradingView pulls news from local sources, making it easier for traders to connect chart patterns with headlines quickly. Having the latest RBI announcements or budget updates linked alongside price charts adds context, helping avoid simple oversights in analysis.
Many traders combine this news integration with alerts to react swiftly to sudden market shifts driven by breaking news, such as GST rate changes or statements from SEBI impacting regulatory aspects.
Time zone settings for Indian Standard Time (IST) are crucial since trading hours and news release timings are linked closely to IST. Traders can set their TradingView platform to IST, ensuring all time stamps on charts, alerts, and financial news match local time. This avoids confusion, especially when trading or monitoring events soon after global market closes — say, after US market hours — allowing traders to line up data accurately with India’s trading schedule.
Free vs paid TradingView subscriptions present a clear cost-benefit scenario. While free plans offer basic charts and indicators, they lack real-time data for NSE/BSE and have limited alerts or saved layouts. Paid versions, starting from Pro to Premium, unlock live Indian market data and permit multiple indicators per chart, which are valuable for detailed technical analysis.
For a retail trader working with a budget of ₹500-1,000 monthly, a Pro or Pro+ plan usually hits the right balance. These paid plans also support simultaneous use across devices — handy if you switch between mobile and desktop during the day.
Features relevant to Indian retail traders generally include access to technical indicators suited for the often volatile Indian market, multiple chart layouts to track diversified portfolios, and alert systems tailored for price actions or indicator crossovers. These tools cater to varied trading styles, from intraday scalping on NSE futures to longer-term investments in blue-chip BSE stocks.
Also, plans offering integration with Indian stock brokers or exporting trade data for tax planning ease tax filing processes linked to capital gains and ITRs.
Maximising value within budget means weighing the frequency and depth of your trades against subscription cost. Casual investors might rely on free plans combined with NSE/BSE data subscriptions, while active traders benefit from higher tiers with multi-chart setups and more frequent alerts.
Using the trial period or monthly billing can also help test features before committing to annual payments. Pairing TradingView’s capabilities with disciplined risk management and trade journaling ensures you get the most out of the platform without overspending.
Tailoring TradingView to India’s market specifics supports smarter trading decisions and better cost control, enabling traders to focus on analysis without wasting resources.
📊 Discover Ripple Coin's price trends, tech updates, market shifts, and regulations. Get expert insights to navigate your investment decisions wisely.
📈 Explore Reliance Industries' target price by 2030 with insights on growth, challenges, and analyst views for informed investing in India 🇮🇳.

Discover Ravi Jaipuria's net worth 💰, business ventures 🏢, key investments 📈, and philanthropic contributions 🤝 shaping India's business world.
Explore QXBroker's trading platforms, account options, fees, support & security 🔍 Get clear insights for Indian traders before choosing your broker!
Based on 15 reviews