

Understanding Bitcoin Cash: A Practical Guide
Learn how Bitcoin Cash (BCH) tackles Bitcoin’s scaling limits with faster, cheaper transactions. A clear guide for Indian crypto enthusiasts and investors 📈💰
Edited By
Amelia Wright
The bearish hammer candlestick pattern captures the attention of traders because it signals a possible shift in market sentiment. This pattern occurs during an uptrend and may hint at a potential reversal towards selling pressure. Unlike the more common bullish hammer, which suggests buyers are gaining strength, the bearish hammer warns that sellers are beginning to take control.
Visually, the bearish hammer has a small real body at the upper end of the candlestick and a long lower wick, at least twice the length of the body. This shape indicates that although prices dropped significantly during the trading session, they recovered partially to close near the opening price. However, the recovery is not strong enough to erase the selling pressure, marking a warning sign for traders.
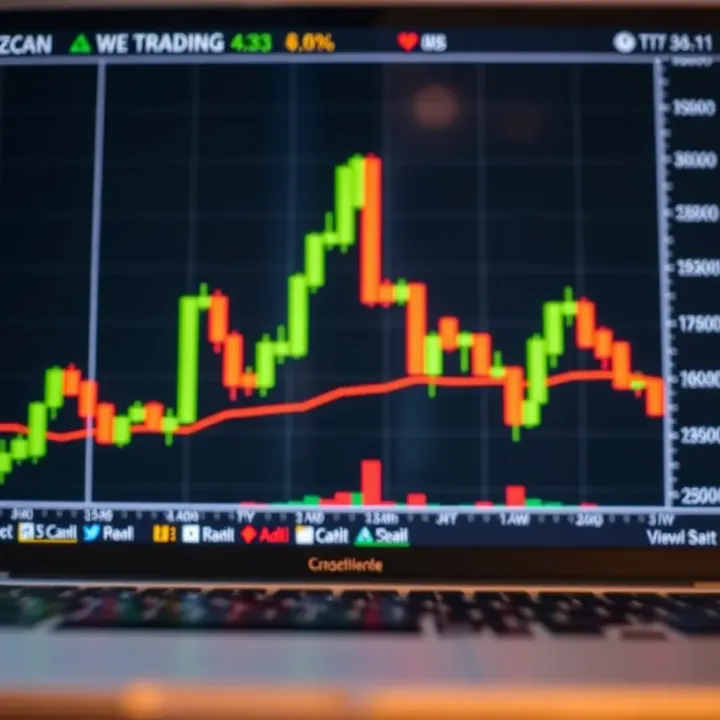
Recognising this pattern requires attention to its location on the chart: it typically forms after a sustained rise in price, acting as a red flag that the bullish momentum might be fading. For example, on the NSE or BSE, if Reliance Industries shares form a bearish hammer after several days of gains, investors may anticipate a slowdown or reversal in the upward trend.
Traders use the bearish hammer pattern alongside other technical tools such as volume analysis, support/resistance levels, or indicators like RSI (Relative Strength Index) to confirm its validity. Higher-than-average volume on the bearish hammer day can add weight to the reversal signal. In the absence of confirmation, relying on the pattern alone can be risky, as false signals may appear in choppy markets.
The bearish hammer is a subtle yet powerful tool; it alerts traders to the possibility that buyers’ grip is weakening, setting the stage for sellers to push the price down.
In India’s context, where volatile swings often follow heavy buying during festive seasons or after corporate results, spotting the bearish hammer helps investors plan exits or protective measures like stop-loss orders. Understanding this candlestick pattern can improve timing decisions and reduce the risk of holding into a downturn.
To sum up, while the bearish hammer is not a guarantee of a short-term market drop, it offers a valuable hint of changing forces. Observing it closely within the broader price action can enhance trading strategies and portfolio management.
A bearish hammer candlestick stands out as a vital signal in technical analysis, indicating a possible reversal from a bullish to a bearish trend. Recognising this pattern helps traders anticipate downward price movements early, improving their entry and exit timing in volatile markets like the Sensex and Nifty. The pattern’s distinct shape and price placement make it a reliable visual cue when combined with volume and other indicators.
The bearish hammer typically features a small real body near the candle’s upper end and a long lower shadow at least twice the length of the body. This long wick shows that sellers pushed the price down significantly during the session, but buyers managed to bring it back near the opening price. However, the close still remains lower compared to the previous candlestick, highlighting the sellers’ eventual control.
This long lower shadow reflects market hesitation and a fight between bulls and bears, making it particularly relevant on lower time frames like hourly or daily charts where quick shifts in sentiment matter.
In a bearish hammer, the open and close prices are positioned close to the top of the candlestick, signalling limited upward movement despite initial selling pressure. The high is usually near the open, and the low extends well below the body showing significant rejection of lower prices. This price structure offers traders clues about the battle between buyers and sellers during that period.
Recognising these placements aids in differentiating bearish hammers from other patterns. For example, if the close is above the open with a similar shadow, it signals a bullish hammer instead.
While the bearish hammer indicates potential bearish reversals, the bullish hammer signals a reversal to the upside. The key difference lies in the closing price relative to the open. In a bullish hammer, the close is above the open, reflecting buyers overcoming early selling pressure. In contrast, the bearish hammer closes lower, reinforcing bearish sentiment.
For instance, a day when Reliance Industries shows a bearish hammer on the daily chart might caution traders about coming price drops, whereas a bullish hammer suggests prices could soon climb.
The hanging man resembles a bearish hammer but appears after an uptrend, implying a warning rather than confirmation of a reversal. Thus, its context is crucial. The inverted hammer has a small real body at the bottom with a long upper wick, signalling a possible bullish reversal, not bearish.
Understanding these subtle but important differences prevents misreading signals, especially when analysing Indian stocks with volatile sessions. Traders should combine pattern recognition with market context for better accuracy.
The bearish hammer’s power lies in its clear visual message about sellers gaining ground after an attempted bounce, making it a handy tool alongside volume and trend analysis in Indian markets.
This section gives you essential knowledge to spot bearish hammers properly and differentiate them from similar-looking candles, helping you avoid trading errors.
Understanding the market psychology behind the bearish hammer candlestick pattern is key for traders to interpret price action accurately. This pattern reveals the tussle between buyers and sellers within a session, reflecting shifting sentiments that may lead to a price reversal. Recognising these underlying forces helps traders avoid rash decisions based on surface-level price movements.
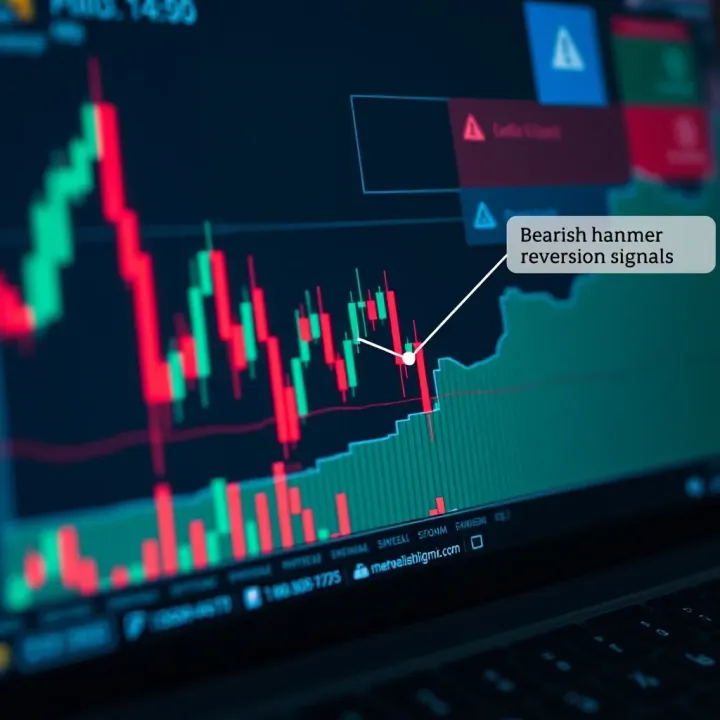
The bullish part of the bearish hammer occurs when buyers enter the market after a sharp price drop, pushing prices higher during the session. This temporary rebound shows that buyers are willing to step in, possibly seeing value or expecting a turnaround. Yet, this momentum often lacks strength to hold. For example, in the Indian stock markets, a stock like Reliance Industries might fall sharply in the morning but recover somewhat by afternoon, reflecting buying attempts. However, these efforts may be short-lived if sellers regroup.
Despite the intraday buying pressure, sellers regain control near the close, driving prices back down towards the opening or below. This dominance at the end of the session signals that sellers remain in command, outweighing buyers’ attempts to sustain gains. The closing price near the session low conveys weakening buyer conviction. In practical terms, this suggests the bears could push prices further down the next day, making the pattern a warning for traders holding long positions.
A bearish hammer often forms where price faces resistance, showing clear rejection from higher levels. The long lower shadow highlights that, although prices dipped significantly, the market rejected these depths partly. Such rejection indicates uncertainty and failed bullish attempts, especially when followed by a weak close. For instance, in an IT stock on the NSE, if the price plunges during the day but closes only marginally higher than the open, it suggests hesitation among buyers and possible resistance above.
The market is essentially saying: "We tried to go up, but sellers aren’t ready to let go just yet."
This pattern often marks the beginning of bearish momentum as sellers prepare to push prices further down. The inability of buyers to sustain higher prices means shorts might enter or increase their positions, expecting a downtrend. Combined with volume spikes on the downside, this momentum formation gains credibility. In practical trading, such momentum signals starting positions for short selling or tightening stops on existing longs.
By grasping these psychological cues behind the bearish hammer, traders can better judge when the pattern signals just a temporary hesitation versus a robust potential price drop. This insight aids in developing more refined entry and exit strategies aligned with prevailing market sentiment.
Trading strategies that rely on the bearish hammer candlestick focus on recognising points where market sentiment shifts from bullish to bearish. This pattern offers signals for cautious traders to consider short positions or tighten risk controls. However, depending on a bearish hammer alone isn’t enough—it's most effective when combined with other signals and risk management.
Short Selling Signals
A bearish hammer signals potential downward reversals, making it useful for timing short selling. When you spot this pattern at the top of an uptrend or after a price rally, it suggests buying interest could be fading. Traders often use it as a cue to enter short positions anticipating a price drop. For example, if the Nifty 50 shows a bearish hammer after touching a resistance level around 18,000 points, a trader might short sell expecting a reversal.
Stop Loss Placement
Setting a stop loss is critical to manage risk, especially when trading reversal patterns. Typically, traders place a stop loss just above the high of the bearish hammer candlestick. This ensures that if prices move contrary to expectations and break above the hammer’s peak, losses are minimised. For instance, if a stock's bearish hammer high is at ₹1,200, placing a stop loss at ₹1,210 provides a clear exit should the price invalidate the bearish signal.
Confirming With Relative Strength Index (RSI)
The Relative Strength Index (RSI) measures the speed and change of price movements, signalling overbought or oversold conditions. When a bearish hammer forms while the RSI is above 70, it strengthens the reversal signal, as the market may be overbought and ready to decline. Conversely, if RSI remains neutral or low, the bearish hammer’s reliability weakens. Traders should look for this confirmation before acting.
Role of Moving Averages
Moving averages help identify trends and support-resistance levels. A bearish hammer appearing near the 50-day or 200-day moving average, especially after a price touch or bounce, adds weight to a possible trend reversal. For example, if a Sensex stock forms a bearish hammer just below its 200-day moving average, it might indicate sellers are gaining control. Using moving averages alongside the bearish hammer guides traders whether to enter or stay out of a trade.
Combining the bearish hammer pattern with volume spikes, RSI signals, and moving averages can reduce false alarms and help you pinpoint effective entry and exit points.
In trading, the bearish hammer offers a strong visual cue but pairing it with other indicators and strict stop loss rules ensures more disciplined and potentially profitable trades.
The bearish hammer candlestick serves as a useful indicator for potential market reversals. However, traders and analysts must understand its boundaries to avoid costly misinterpretations. Like any tool, the bearish hammer does not guarantee outcomes and can sometimes send misleading signals. This section explores key limitations and the precautions you should take when using this pattern in your trading decisions.
A bearish hammer candlestick alone shouldn’t trigger a trade. It often appears amid market noise—random price fluctuations that don’t signal a genuine reversal. Confirming the pattern with additional tools, like volume spikes or momentum indicators such as the Relative Strength Index (RSI), adds reliability. For example, a bearish hammer forming in a thinly traded stock may be less trustworthy than one appearing alongside a drop in RSI confirming weakening momentum.
Traders who neglect confirmation risk entering positions based on false signals. One common practice is to wait for the next candlestick to close below the hammer’s low, signalling that sellers are taking control. Without this confirmation, the pattern might simply represent a pause or minor pullback within an ongoing uptrend.
Some traders jump in immediately after spotting a bearish hammer. Acting too quickly can be risky, especially in volatile markets where prices swing wildly within a single session. The hammer’s long lower shadow sometimes reflects a temporary dip that buyers quickly recover from, rather than a sustained bearish reversal.
A practical approach is to treat the bearish hammer as an early warning rather than a definitive signal. Giving the market time to confirm the reversal through subsequent candles or supporting technical indicators helps reduce premature trading decisions. In Indian markets, where intraday volatility can be sharp due to economic news or global cues, this patience can save traders from getting caught in whipsaws.
A bearish hammer’s significance varies depending on the broader trend and the time frame analysed. In a strong uptrend, a single bearish hammer might not halt momentum but instead signal a brief pause. Conversely, the same pattern identified after an extended rally or at key resistance levels gains more importance.
Choosing the right time frame also matters. Daily charts may show more reliable patterns compared to intraday charts, where noise is higher. Indian traders watching Nifty or Sensex may find that bearish hammers on weekly charts indicate stronger turning points than those on 5-minute candlestick charts.
Not all bearish hammers behave the same across different sectors or stocks. For instance, cyclical sectors like automotive or metals may display more frequent volatile patterns due to global demand swings. In contrast, defensive sectors like pharmaceuticals might show more muted movements.
Also, stocks with low liquidity can distort pattern signals since prices may gap due to a few large trades, not broad market sentiment. A bearish hammer on such stocks in exchanges like BSE or NSE may require extra scrutiny and confirmation through sectoral trends or fundamental news to avoid misleading conclusions.
Remember, the bearish hammer is a tool—not a crystal ball. Use it alongside careful analysis of market context, confirmation signals, and cautious timing to manage risks effectively.
By understanding these limitations and adjusting strategies accordingly, you can better harness the bearish hammer pattern’s potential without falling prey to common pitfalls.
Examining practical examples of the bearish hammer pattern within Indian markets adds depth to theoretical knowledge. This approach helps traders and analysts see how the pattern behaves in real scenarios, especially amid the complexities of the Sensex and Nifty index stocks. Understanding these examples sharpens one’s skill in spotting genuine reversal signals and avoiding misinterpretation caused by market noise.
A recent example from the Nifty 50 involved Reliance Industries, where a bearish hammer appeared after a sustained uptrend in late 2023. The candlestick showed a long lower shadow and a small real body near the high of the session, signalling potential sellers’ return. Following this pattern, the stock slipped by around 4% over the next two weeks, confirming the bearish reversal indicated. Such examples illustrate the value of watching for this pattern at key resistance levels in heavily traded stocks.
Similarly, in the Sensex, Tata Steel showed a bearish hammer during a volatile phase in early 2024. However, the subsequent price action did not confirm a downtrend as buyers quickly regained control. This case highlights the need for additional confirmation before acting on a bearish hammer, as false signals can occur especially in stocks with high intraday swings.
Successful bearish hammer signals typically coincide with volume spikes or occur alongside other indicators like a declining Relative Strength Index (RSI). For instance, Maruti Suzuki's bearish hammer in March 2024 came with increased selling volume, signalling stronger bearish conviction. The consequent price fall validated the pattern’s reliability in this context.
On the other hand, failed signals often happen during sideways markets or when broader market sentiment counters the bearish indication. The Tata Steel example shows how ignoring the overall trend and volume context can lead to premature trades, resulting in losses.
The rapid adoption of digital payment platforms like Unified Payments Interface (UPI) has indirectly influenced trading volumes, especially in retail-driven stocks. Increased liquidity and faster transactions have led to more volatile price moves, making candlestick patterns like the bearish hammer more visible but sometimes harder to interpret. Traders should note that sudden spikes in volume accompanying a bearish hammer may partly result from digital payments integration effects rather than pure selling pressure.
Technological advancements captured through user trends on platforms like DigiLocker can signal sectoral shifts. For example, rising digitisation in finance and insurance sectors often shows up in stock price actions before fundamental reports. Observing bearish hammer patterns in IT-related stocks alongside DigiLocker user growth data may foreshadow changes in market sentiment. Thus, combining technical analysis with digital economy trends offers a fuller picture of where opportunities or risks lie.
Watching how the bearish hammer behaves in real Indian market contexts lets you act smarter, backed by practical evidence rather than theory alone. Always pair pattern recognition with volume, trend, and sector insights for better trading decisions.
Learn how Bitcoin Cash (BCH) tackles Bitcoin’s scaling limits with faster, cheaper transactions. A clear guide for Indian crypto enthusiasts and investors 📈💰

Explore practical steps to trade Ethereum effectively 🔥 Understand market analysis, risk management, strategies, and tools tailored to Indian and global traders.
📊 Understand deriv trading basics, types, risks & regulations in India. Get tips for smart investing and explore top platforms for CFDs, options & futures trading.

Explore Qutex Trade's platform features, market stance, trading options, security, and user experience for informed trading decisions 🔒📈💼
Based on 14 reviews