
Understanding the DAX Index: Key Facts and Investment Tips
📈 Explore the DAX index's structure, history, and key drivers. Learn how Indian investors can tap into Germany's top 40 stocks with practical trading tips. 🌍
Edited By
Charlotte Green
The DAX Index stands as Germany's premier stock market indicator, tracking the performance of the 40 largest companies listed on the Frankfurt Stock Exchange. It serves not only as a barometer for the German economy but also holds significant influence in global financial markets, including Indian investors who increasingly diversify their portfolios across international assets.
Established in 1988, the DAX initially included 30 companies before expanding to 40 in September 2021. Its historical data offers vital insights into market behaviour, investor sentiment, and economic cycles across decades. For traders and analysts, studying this data helps in spotting long-term trends, volatility patterns, and responses to major events like the global financial crisis of 2008 or the COVID-19 pandemic.
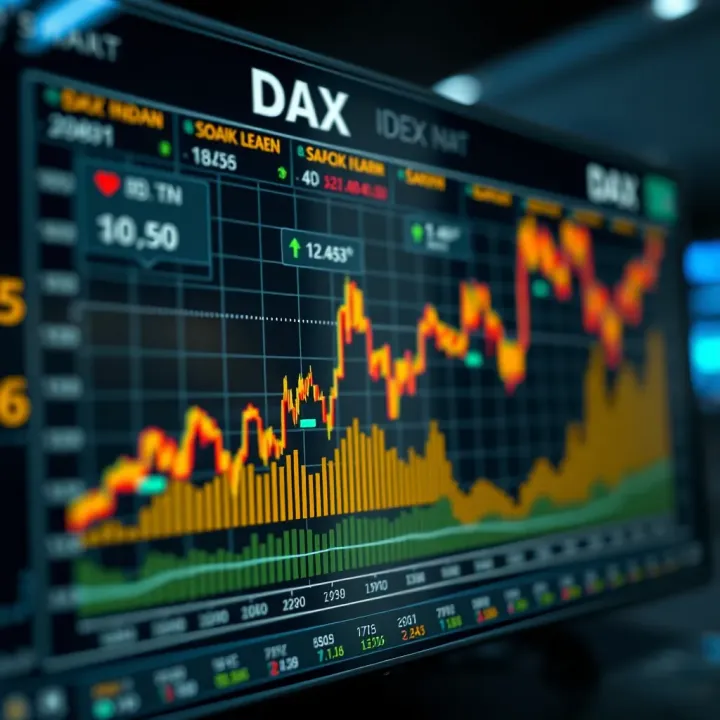
Understanding the DAX's price movements and historical shifts equips investors with a clearer perspective for making informed decisions, particularly in volatile times.
Accessing the DAX's historical data is straightforward for professionals using platforms such as Bloomberg, Reuters, or stock exchanges like Deutsche Börse. Indian traders can also use NSE's international equities section or financial websites offering downloadable time series data. This information typically includes daily open, high, low, close prices, and volume figures, enabling comprehensive technical and fundamental analysis.
Key trends in the DAX reflect global economic developments, sectoral shifts, and geopolitical factors. For instance, the prominence of automotive and industrial giants like Volkswagen and Siemens in the index underscores Germany's manufacturing strength. The gradual inclusion of technology and healthcare firms shows the evolving business landscape.
Investors must note that historical performance does not guarantee future results, but it does provide a valuable context. Strategic asset allocation can benefit from insights into how the DAX reacted to rate changes by the European Central Bank or trade tensions affecting exports.
This section sets the stage for a deeper look at the DAX's origin, methods to retrieve its historical data, and the practical implications these trends hold for investors both globally and in the Indian market.
Understanding the origins and composition of the DAX Index is essential for traders and investors who rely on its data to make informed decisions. The index represents a key barometer of Germany’s stock market, highly influential in European financial markets. Knowing where it comes from and how its components are chosen gives valuable context to its movements and investment potential.
The DAX (Deutscher Aktienindex) was launched on 1 July 1988 by the Frankfurt Stock Exchange. It initially tracked 30 of Germany's largest and most actively traded blue-chip companies. The need for such an index arose as Germany’s economy was rapidly integrating into global markets, requiring a reliable benchmark representing corporate health and investor sentiment.
Unlike many indices, the DAX calculates performance based on price and dividends, reflecting total returns rather than just price changes. This approach adds depth to historical data analysis, especially for long-term investors. For example, over the 1990s, the reinvestment of dividends boosted total returns significantly, a detail critical for evaluating the DAX's actual historical profitability.
The DAX’s composition consists of the 40 largest German companies by market capitalisation and order book volume. Market capitalisation is adjusted for freely tradable shares, excluding states or strategic holdings, ensuring the index captures genuine market dynamics.
Companies are reviewed quarterly to maintain the list's relevance, allowing new entrants that better represent Germany’s current economic landscape. For instance, automotive giant Volkswagen and chemical company BASF have long been mainstays, while tech firms like SAP have gained prominence reflecting shifts in industry importance.
The selection criteria focus not just on size but liquidity and sector balance. This ensures the DAX remains a fair representation of the overall market, avoiding over-concentration.
For investors analysing historical data, understanding index composition changes is key. A stock included in the index at one point but removed later will affect historical performance differently than a constantly included company. Thus, tracking these changes helps in accurate backtesting and performance comparisons.
By grasping the launch context and the method for choosing constituents, analysts can better interpret DAX historical data, linking market shifts to real economic changes in Germany’s leading companies.
Accessing reliable historical data for the DAX Index is essential for traders, investors, and analysts aiming to understand market trends and inform investment decisions. The right sources provide accuracy, timeliness, and comprehensive coverage, which help users analyse past performance and predict potential future movements. The methods of access range from official platforms to advanced financial tools, each catering to different needs and expertise levels.
The easiest way to obtain DAX historical data is through official sources like Deutsche Börse, which manages the DAX Index. Its website provides downloadable datasets encompassing daily closing prices, highs, lows, and volumes. Such data is public and free, making it convenient for retail investors and analysts to start their research without additional costs.
Leading financial websites including Bloomberg, Reuters, and MarketWatch also host comprehensive DAX historical data. These platforms generally offer interactive charts and filters by time frame, which allow quick views of historical trends, comparing periods from weeks to decades. For example, Bloomberg’s terminal-style website lets you track DAX’s performance alongside macroeconomic indicators or relevant news events, putting the numbers in context for better decision-making.
Indian investors often turn to NSE India or Moneycontrol, where global indices like the DAX feature for comparative portfolio analysis. These sites integrate historical data with current market insights, helping users gauge how the DAX’s past movements relate to local investment options.
For professional traders and financial analysts, terminals such as Bloomberg Terminal, Refinitiv Eikon, or FactSet provide high-frequency, detailed historical DAX data. These tools support advanced analytics, allowing users to generate customised reports, apply technical indicators, and automate backtesting strategies.
Application Programming Interfaces (APIs) also serve as efficient methods to access and integrate DAX historical data into proprietary trading algorithms or portfolio management systems. Providers like Alpha Vantage, Quandl, or local entities often offer APIs with free tiers and premium versions depending on required depth and update frequency.
Using APIs allows financial firms or tech-savvy investors to pull data in real time and combine it with other datasets like currency rates, economic indicators, or corporate earnings. This capability is important for creating nuanced investment models driven by historical patterns and real-world events.
Accessing DAX historical data from trusted platforms and through robust methods plays a pivotal role in crafting well-informed investment strategies. Whether for simple reference or complex quantitative models, this data remains the backbone of market analysis.
In summary, combining official platforms for foundational data with specialised financial terminals or APIs equips investors and analysts with a broad toolkit. This approach ensures they tap into accurate historical perspectives, making it easier to understand the DAX’s behaviour and leverage it for their investment goals.
Understanding the major historical trends and market cycles of the DAX index reveals how this German market barometer has navigated through various economic phases. These patterns offer traders and analysts a clear perspective on momentum shifts, helping to anticipate future moves rather than just reacting to numbers.
The DAX has witnessed several pronounced bull and bear phases that indicate investor sentiment swings. For instance, the tech bubble from the late 1990s to early 2000 saw the DAX surge, mirroring global enthusiasm for information technology. However, its burst led to a steep bear phase until around 2003. Similarly, the 2008 global financial crisis triggered a sharp bear market with the DAX losing nearly 50% in value within months. On the flip side, the recovery between 2009 and 2015 marked a strong bull run, with the index more than doubling, fuelled by economic stabilisation and eased monetary policies.
Recognising these phases is vital for timing market entries and exits. Traders relying solely on current prices without contextualising them in historic cycles may miss out on key signals. For example, the post-2020 Covid-19 crash quickly reversed into a swift bull phase as stimulus packages rolled out, showing how understanding cycles fast can profit investors.
The DAX does not operate in isolation; it is heavily influenced by global events given Germany’s trade-driven economy. Events like the Eurozone debt crisis around 2010-2012 dented investor confidence, dragging the DAX down amid fiscal uncertainty in neighbouring countries. Similarly, geopolitical tensions, such as trade wars or Brexit negotiations, have also caused volatility, reflecting risk-off sentiment among investors.
More recently, the DAX responded sharply to changes in U.S. Federal Reserve interest rates and policies from the European Central Bank (ECB). These external factors affect liquidity, currency strength, and export competitiveness, inching the index up or down accordingly.
Historical context of such global impulses enables analysts to distinguish between temporary dips caused by external shocks and fundamental shifts requiring a change in investment strategy.
For Indian investors and global traders tracking the DAX, understanding such worldwide influences can guide better diversification and hedging strategies. It highlights why watching only local factors isn’t enough; global macroeconomic shifts often ripple through the DAX and subsequently other markets.
Historical data of the DAX Index provides a solid foundation for informed investment decisions. Investors and analysts rely on this data to identify market cycles, evaluate risk, and construct strategies suited to their financial goals. Simply put, understanding past market behaviour helps foresee potential future trends, though not with absolute certainty.
Technical analysts examine historical DAX charts to spot price patterns and trading signals. By studying trends, support and resistance levels, and moving averages, they try to predict short-term price movements. For example, a trader might use the 50-day and 200-day moving average crossover to signal a potential uptrend or downtrend. Volume patterns combined with price action can also highlight buying or selling pressure.
Technical indicators such as the Relative Strength Index (RSI) or Moving Average Convergence Divergence (MACD) often rely on historical data points to gauge market momentum. These tools help traders decide entry or exit points without depending solely on fundamental factors.
Long-term investors use DAX’s historical data to balance their portfolios and manage risk. For instance, during extended bear phases like the 2008 global financial crisis, many investors shifted assets from equities to safer instruments. Classes rely on historical drawdowns and recovery durations to set stop-loss limits or determine diversification needs.
Moreover, understanding the DAX's responsiveness to economic events enables strategic allocation between sectors or geographies. An Indian investor might compare DAX's past returns with the Sensex to decide on international diversification, considering currency fluctuations and geopolitical stability.
Historical performance doesn’t guarantee future results but offers valuable context. Effective use of past data sharpens both tactical trades and strategic asset allocation.
In summary, the DAX’s historical data aids financial professionals in spotting patterns, evaluating risks, and tailoring strategies that fit their investment horizon and objectives. This insight is crucial not only for traders aiming at quick profits but also for portfolio managers focusing on long-term wealth creation.
Comparing DAX historical data with other major global indices helps investors understand its relative performance and market behaviour in a wider context. Tracking multiple indices like the DAX, Sensex, and S&P 500 reveals how each responds to economic shifts, geopolitical upheavals, or sectoral trends. This comparison not only highlights the unique characteristics of Germany’s market but also points to patterns useful for portfolio diversification and risk assessment.
The DAX, Sensex (India’s benchmark), and S&P 500 (US) differ fundamentally in composition and economic drivers. Historically, the DAX shows strong ties to European industrials and export sectors, while the Sensex reflects India’s service and manufacturing segments. For example, during the 2008 global financial crisis, the DAX suffered steep losses but rebounded quicker in the following years due to Germany’s export recovery. On the other hand, the Sensex gained more steadily post-2010, driven by expanding domestic consumption and reforms.
In recent years, the S&P 500’s tech-heavy nature led to outsized gains, especially evident during the 2020 pandemic when technology and digital services flourished worldwide. The DAX lagged somewhat due to its industrial and automotive weighting. This difference shows Indian investors why having global exposure beyond local markets like the Sensex can balance sector-specific risks.
Indian investors eyeing international diversification can benefit greatly from analysing DAX historical trends alongside domestic indices. The DAX’s sensitivity to Eurozone economic health and monetary policy signals global economic shifts that may affect Indian portfolios indirectly. For instance, disruptions in German manufacturing exports could impact global supply chains, thereby hitting Indian exporters.
Moreover, the DAX's dividend yields and volatility patterns differ from Indian markets, allowing investors to tailor risk-return profiles suited to personal investment goals. Understanding these nuances helps in timing investments better during phases of global uncertainty.
By comparing DAX data with other global indices, Indian investors can make informed choices about allocating assets internationally, minimising risks that local markets alone cannot hedge against.
In practical terms, platforms like NSE India or international brokers now provide tools to monitor such cross-market data conveniently. Keeping an eye on historical patterns across indices can unearth opportunities and caution signals for smarter investment decisions.
📈 Explore the DAX index's structure, history, and key drivers. Learn how Indian investors can tap into Germany's top 40 stocks with practical trading tips. 🌍
Explore Exness in India: learn about its trading platforms, account types, regulations, and fees. Get tips on safe forex and CFD trading for Indian traders 🇮🇳📈
📊 Explore the Quotex trading course to master asset types, trading tips, and education strategies. Perfect for beginners & pros aiming for smarter trades!
Explore Rajiv Jain's net worth 💰, career milestones, key investments 📈, and financial strategies shaping his wealth in India's market landscape 🇮🇳.
Based on 8 reviews